Reports
This functionality is available only in the Advanced edition of the Cyber Protection service.
A report about operations can include any set of the dashboard widgets. All of the widgets show the summary information for the entire company. All of the widgets show the parameters for the same time range. You can change this range in the report settings.
You can use default reports or create a custom report.
The set of default reports depends on the Cyber Protection service edition that you have. The default reports are listed below:
| Report name | Description |
|---|---|
| #CyberFit Score by machine | Shows the #CyberFit Score, based on the evaluation of security metrics and configurations for each machine, and recommendations for improvements. |
| Alerts | Shows alerts that occurred during a specified time period. |
| Backup scanning details | Shows the detailed information about detected threats in the backups. |
| Daily activities | Shows the summary information about activities performed during a specified time period. |
| Data protection map | Shows the detailed information about the number, size, location, protection status of all important files on machines. |
| Detected threats | Shows the details of the affected machines by number of blocked threats and the healthy and vulnerable machines. |
| Discovered machines | Shows all found machines in the organization network. |
| Disk health prediction | Shows predictions when your HDD/SSD will break down and current disk status. |
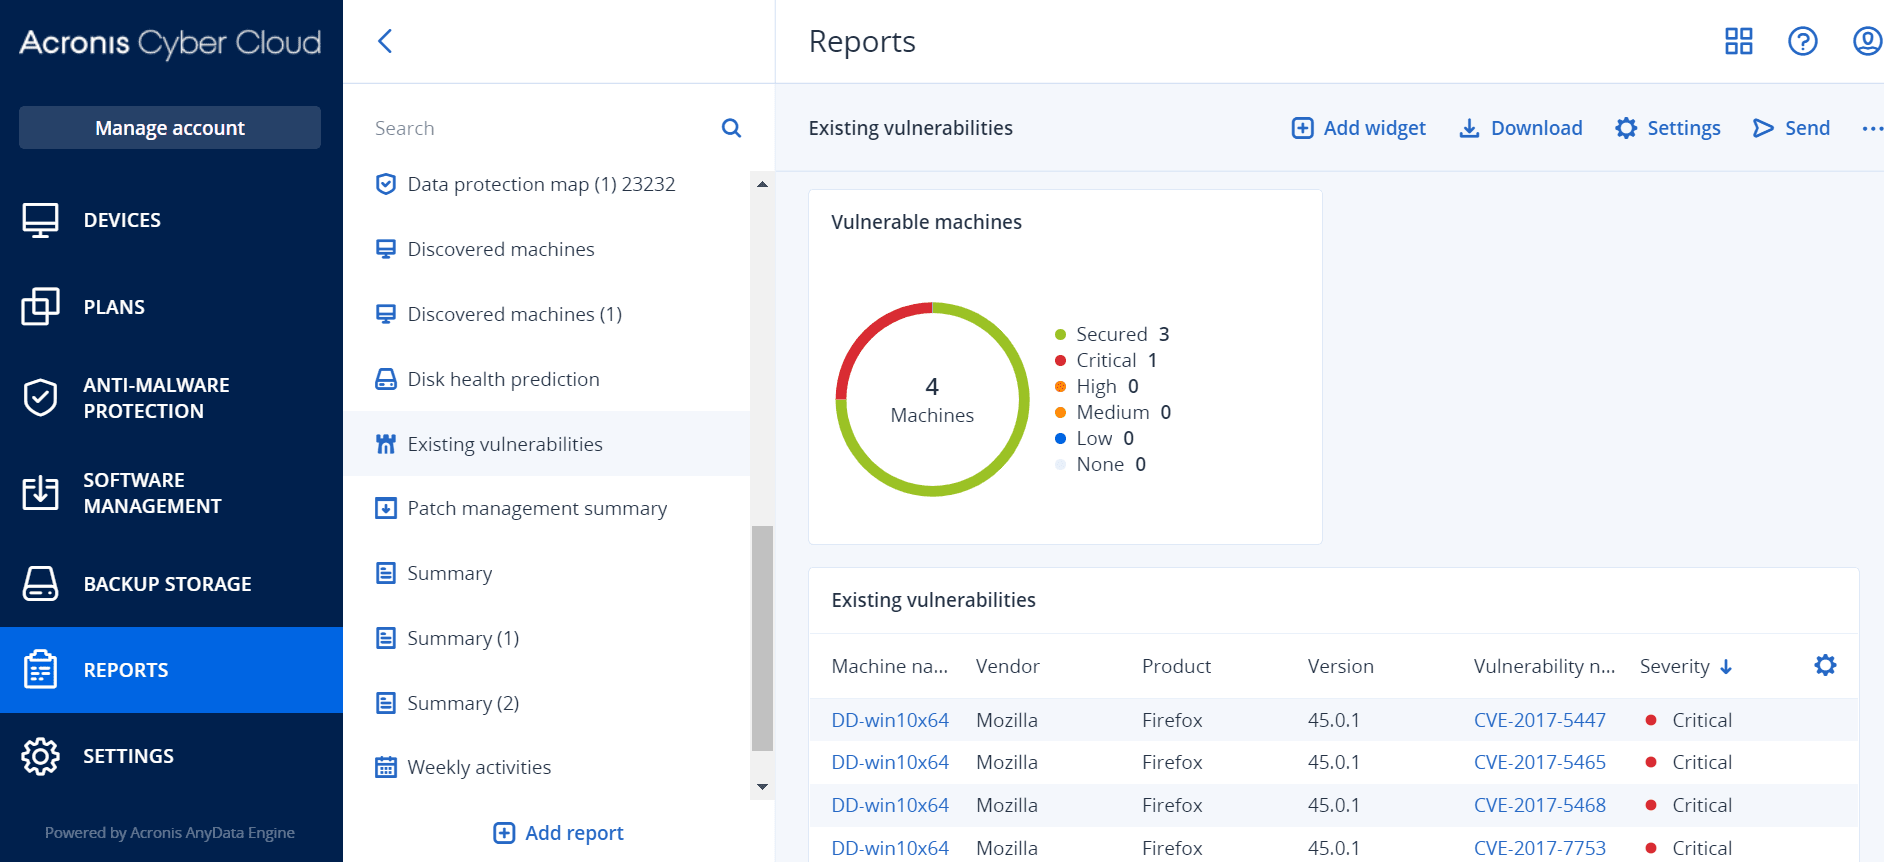
| Existing vulnerabilities | Shows the existing vulnerabilities for OS and applications in your organization. The report also displays the details of the affected machines in your network for every product that is listed. |
| Patch management summary | Shows the number of missing patches, installed patches, and applicable patches. You can drill down the reports to get the missing/installed patch information and details of all the systems. |
| Summary | Shows the summary information about the protected devices for a specified time period. |
| Weekly activities | Shows the summary information about activities performed during a specified time period. |
To view a report, click its name.
To access operations with a report, click the ellipsis icon on the report line. The same operations are available from within the report.
Adding a report
- Click Add report.
-
Do one of the following:
- To add a predefined report, click its name.
- To add a custom report, click Custom, click the report name (the names assigned by default look like Custom(1)), and then add widgets to the report.
- [Optional] Drag and drop the widgets to rearrange them.
- [Optional] Edit the report as described below.
Editing a report
To edit a report, click its name, and then click Settings. When editing a report, you can:
- Rename the report
- Change the time range for all widgets included in the report
- Schedule sending the report via email in the .pdf or/and .xlsx format
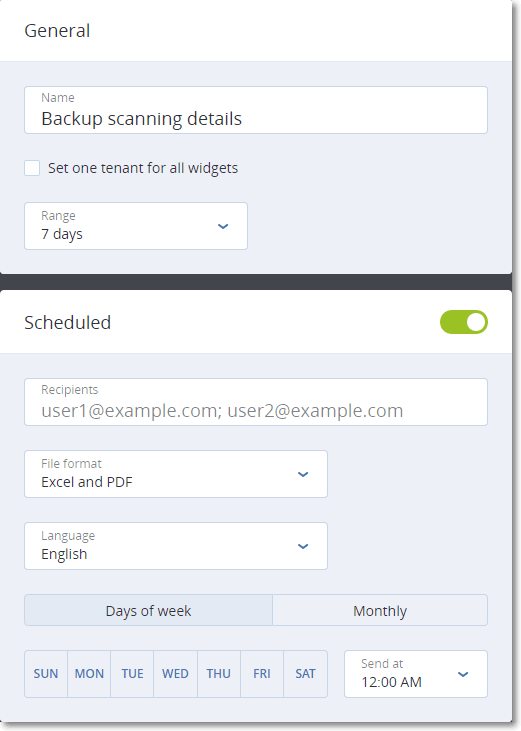
Scheduling a report
- Click the report name, and then click Settings.
- Enable the Scheduled switch.
- Specify the recipients' email addresses.
- Select the report format: .pdf, .xlsx, or both.
- Select the days and the time when the report will be sent.
- Click Save in the upper right corner.
The maximum number of exported items is: in a .pdf file—1000; in an .xlsx file—10 000.
Exporting and importing the report structure
You can export and import the report structure (the set of widgets and the report settings) to a .json file.
To export the report structure, click the report name, click the ellipsis icon in the top-right corner, and then click Export.
To import the report structure, click Add report, and then click Import.
Downloading a report
You can download a report, click Download and select the formats needed:
- Excel and PDF
- Excel
Dumping the report data
You can send a dump of the report data in a .csv file via email. The dump includes all of the report data (without filtering) for a custom time range. The timestamps in CSV reports are in the UTC format whereas in Excel and PDF reports the timestamps are in the current system time zone.
The software generates the data dump on the fly. If you specify a long period of time, this action may take a long time.
- Click the report name.
- Click the ellipsis icon in the top-right corner, and then click Dump data.
- Specify the recipients' email addresses.
- In Time range, specify the time range.
- Click Send.
The maximum number of items exported in a .csv file is 150 000.