Monitoring
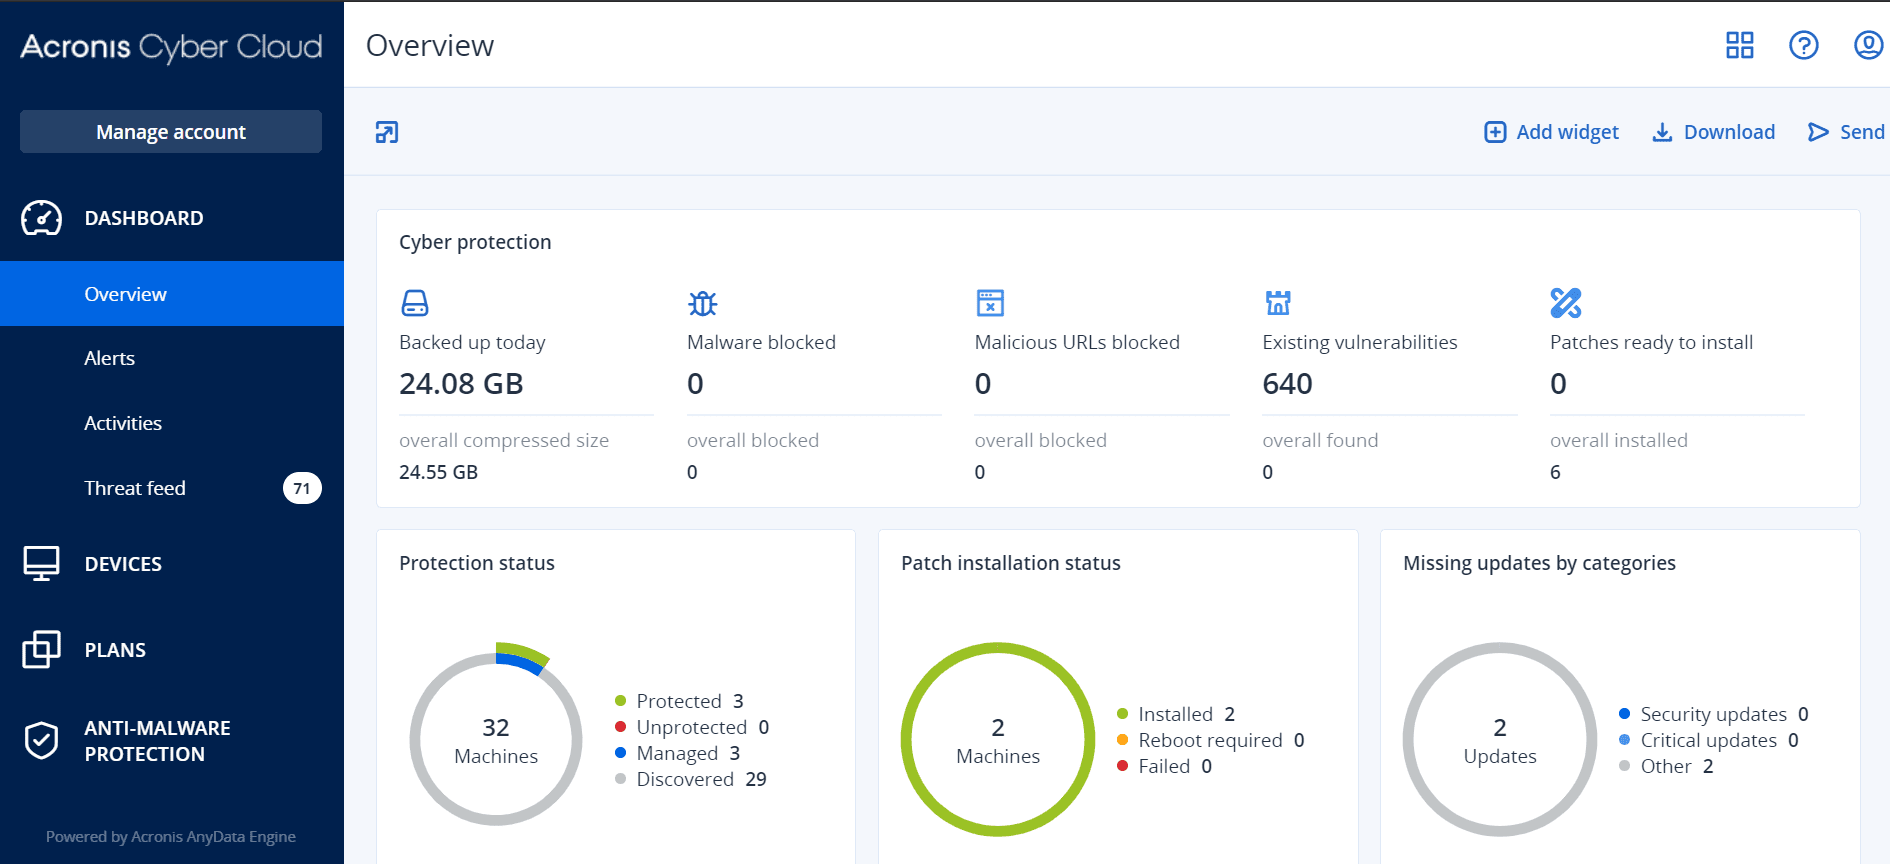
The Overview dashboard provides a number of customizable widgets that give an overview of operations related to the Cyber Protection service. Widgets for other services will be available in future releases.
The widgets are updated every five minutes. The widgets have clickable elements that enable you to investigate and troubleshoot issues. You can download the current state of the dashboard or send it via email in the .pdf or/and .xlsx format.
You can choose from a variety of widgets, presented as tables, pie charts, bar charts, lists, and tree maps. You can add multiple widgets of the same type with different filters.
The buttons Download and Send in Dashboard > Overview are not available in the Standard editions of the Cyber Protection service.
To rearrange the widgets on the dashboard
Drag and drop the widgets by clicking on their names.
Click the pencil icon next to the widget name. Editing a widget enables you to rename it, change the time range, set filters, and group rows.
Click Add widget, and then do one of the following:
- Click the widget that you want to add. The widget will be added with the default settings.
- To edit the widget before adding it, click Customize when the widget is selected. After editing the widget, click Done.
Click the X sign next to the widget name.
The Activities dashboard provides a list of events that occurred during the past 90 days. You can search by device name or filter the activities by status, type, or custom time period.