Endpoint Detection and Response (EDR) widgets
Endpoint Detection and Response (EDR) includes seven widgets, all of which can be accessed from the Overview dashboard; three of these widgets are also displayed by default within the EDR functionality (see Reviewing incidents).
The seven widgets available are:
- Top incident distribution per workload
- Threat status (displayed in EDR)
- Incident severity history (displayed in EDR)
- Security incident MTTR
- Security incident burndown
- Detection by tactics (displayed in EDR)
- Workload network status
Top incident distribution per workload
This widget displays the top five workloads with the most incidents (click Show all to redirect to the incident list, which is filtered according to the widget settings).
Hover over a workload row to view a breakdown of the current investigation state for the incidents; the investigation states are Not started, Investigating, Closed, and False positive. Then click on the workload you want to analyze further; the incident list is refreshed according to the widget settings.

Threat status
This widget displays the current threat status for all workloads, highlighting the current number of incidents that are not mitigated and that need investigating. The widget also indicates the number of incidents that were mitigated (manually and/or automatically by the system).
Click on the Not mitigated number to display the incident list filtered to show incidents that are not mitigated.

Incident severity history
This widget displays the evolution of attacks by severity, and can help indicate attack campaigns. When spikes are visible, this can indicate that the organization is under attack.
Hover over the graph to view a breakdown of the incident history at a specific point in the previous 24 hours (the default period). Click on the severity level (Critical, High, or Medium) if you want to view the list of related incidents; you are redirected to the incident list pre-filtered with incidents matching the selected severity level.

Security incident MTTR
This widget displays the average resolution time for security incidents. It indicates how quickly incidents are being investigated and resolved.
Click on a column to view a breakdown of the incidents according to severity (Critical, High, and Medium), and an indication of how long it took to resolve the different severity levels. The % value shown in parentheses indicates the increase or decrease in comparison to the previous time period.

Security incident burndown
This widget shows the efficiency rate in closing incidents; the number of open incidents are measured against the number of closed incidents over a period of time.
Hover over a column to view a breakdown of the closed and open incidents for the selected day. If you click the Open value, the incident list is displayed, and filtered to display incidents currently open (in the Investigating or Not started states). If you click the Closed value, the incident list is displayed, and filtered to display incidents that are no longer open (in the Closed or False positive states).
The % value shown in parentheses indicates the increase or decrease in comparison to the previous time period.

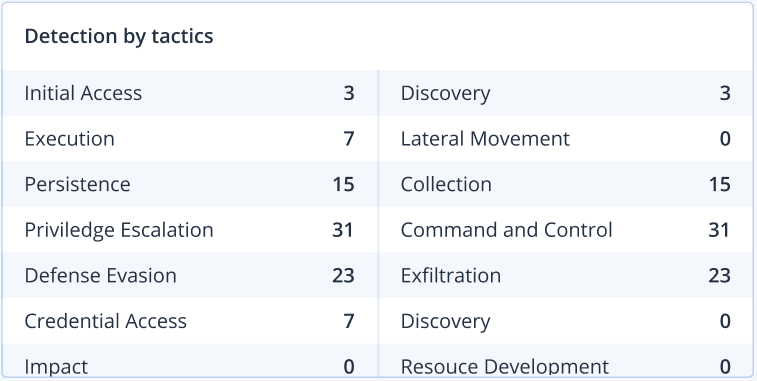
Detection by tactics
This widget displays the number of times specific attack techniques have been found in incidents during the selected period.
The values in green and red indicate if there has been an increase or decrease over the previous time period. In the example below, Privilege Escalation and Command and Control attacks have seen an increase over the previous time period; this could indicate that your credential management needs to be analyzed and security enhanced.
Workload network status
This widget displays the current network status of your workloads, and indicates how many workloads are isolated and how many are connected.
Click the Isolated value to view the Workload with agents list (under the Workloads menu in the Cyber Protect console), which is filtered to display isolated workloads. Click the Connected value to view the Workload with agents list filtered to display connected workloads.
