Viewing bottleneck details
You can view detected bottlenecks for any type of backup, backup replication, or recovery process (to any type of destination folder or location), including virtual machine backups, machine backups, and file/folder backups. You can also view bottlenecks for virtual machine replication and failback activities.
For more information on the definition and core concepts of bottleneck types, see Understanding the detection of bottlenecks.
To view bottleneck details
- In the Cyber Protect console, go to Monitoring > Activities.
-
Click on the relevant activity.
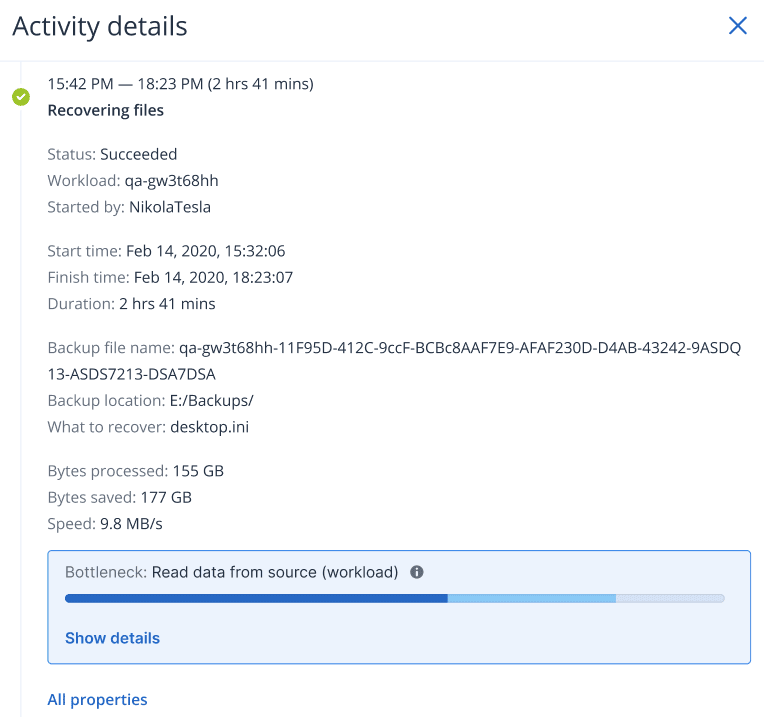
In the Activity details tab, the Bottleneck section is shown in blue.
-
Click Show details to view the most frequently encountered bottleneck during the backup/recovery operation.
The Bottleneck section expands to show a summary of the relevant bottleneck types.
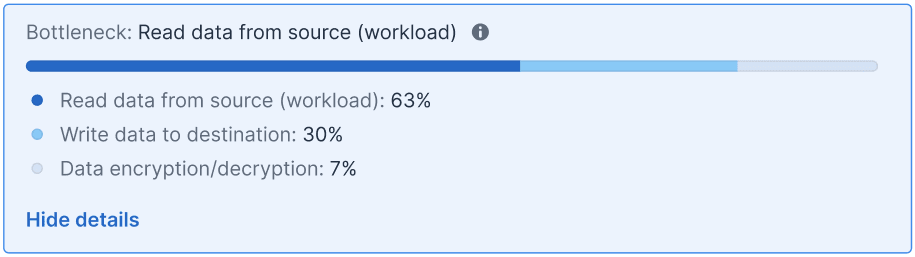
In the example above, the bottleneck that accounted for 63% of the entire operation's time was caused by the Read operation (performed by the agent).
The bottleneck values update dynamically every minute while the corresponding activity is running.